Skip to main content
eGDMD
A knowledge base for early risk factors of GDM
Menu
Search
Search
Main navigation
Home
Home sub-navigation
Browse
Promising RFs and BIRFs
VALIDATION
Search
Search
User account menu
Log in
Breadcrumb
Home
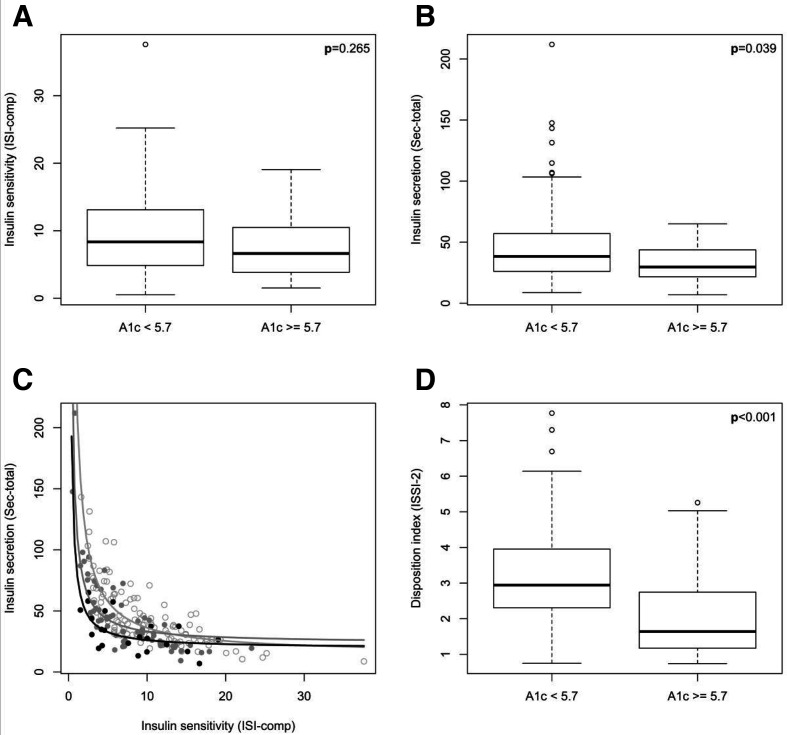
HbA1c
By
admin
, 3 November 2025
evidence entity
HbA1c
whole blood
↑
expression
Figure‘s link
38653036